Chemical Winners 2019: A challenging year and trouble ahead
By Everett Johnson and Robert Henske
Management summary
In 2019, the Chemicals industry's performance showed that the industry was approaching a slowdown and exhibited symptoms of a cyclical industry. There was very little growth associated with new capacity coming online in petrochemicals, and only a third of companies earned their cost of capital.

Shareholder returns looked attractive by historical standards but were driven by general growth in financial markets: the chemicals industry underperformed in the S&P 500 but still experienced growth in value. The industry also saw an increase in leverage and share buy-backs, providing further evidence of a stagnating industry.
With the significant economic impact of COVID-19, we foresee a real performance challenge for the Chemicals industry in 2020. Our vulnerability analysis shows that a quarter of the industry is highly vulnerable to the slow-down. This has significant implications for the evolution of the industry structure going forward.
The magnitude of change ahead largely depends on the type of recovery the economy will experience. We are working on the creation of an industry-wide model that allows us to look at the impact of COVID-19, value chain by value chain, and we will be releasing this report later this month.
Key takeaways on 2019 performance:
- The Chemicals industry significantly underperformed the S&P 500
- Less than a third of companies earned their cost of capital
- At an industry level there was a decline in revenues and even when adjusted for lower raw materials there was no growth
- Slowdown in M&A activity, with deal size decreasing by 35%
- Significant increase in leverage with Debt/EBITDA ratio increasing from 2.3x in 2018 to 2.7x in 2019, as parts of the industry took advantage of lower interest rates and bought back stock
Key takeaways on COVID-19 vulnerability analysis:
- Small Commodity or Specialty companies, with focused portfolios, are the most exposed
- The majority of midcap Diversified players are also highly vulnerable driven by high leverage, their broader portfolios not providing the expected hedge against high exposure to the economic crisis
- Large players are mostly immune to the crisis and in a position to consolidate the industry
The Winners' analysis lets companies understand their performance relative to the industry. The Winners' metrics are described in more detail in the Appendix. Our Roland Berger Chemicals team would welcome the opportunity to offer perspectives on company-specific performance and give you our external view on the strategic challenges facing the industry.
An overview of Roland Berger's Winners' Analysis
As an analytical underpinning to our strategy and operations support to the Chemicals industry, we regularly monitor the financial performance of nearly 170 Chemicals companies headquartered in the US or in Europe. This document provides an inside look of the performance of the industry using both Winners' metrics and conventional financial metrics and highlights trends that these numbers unveil.
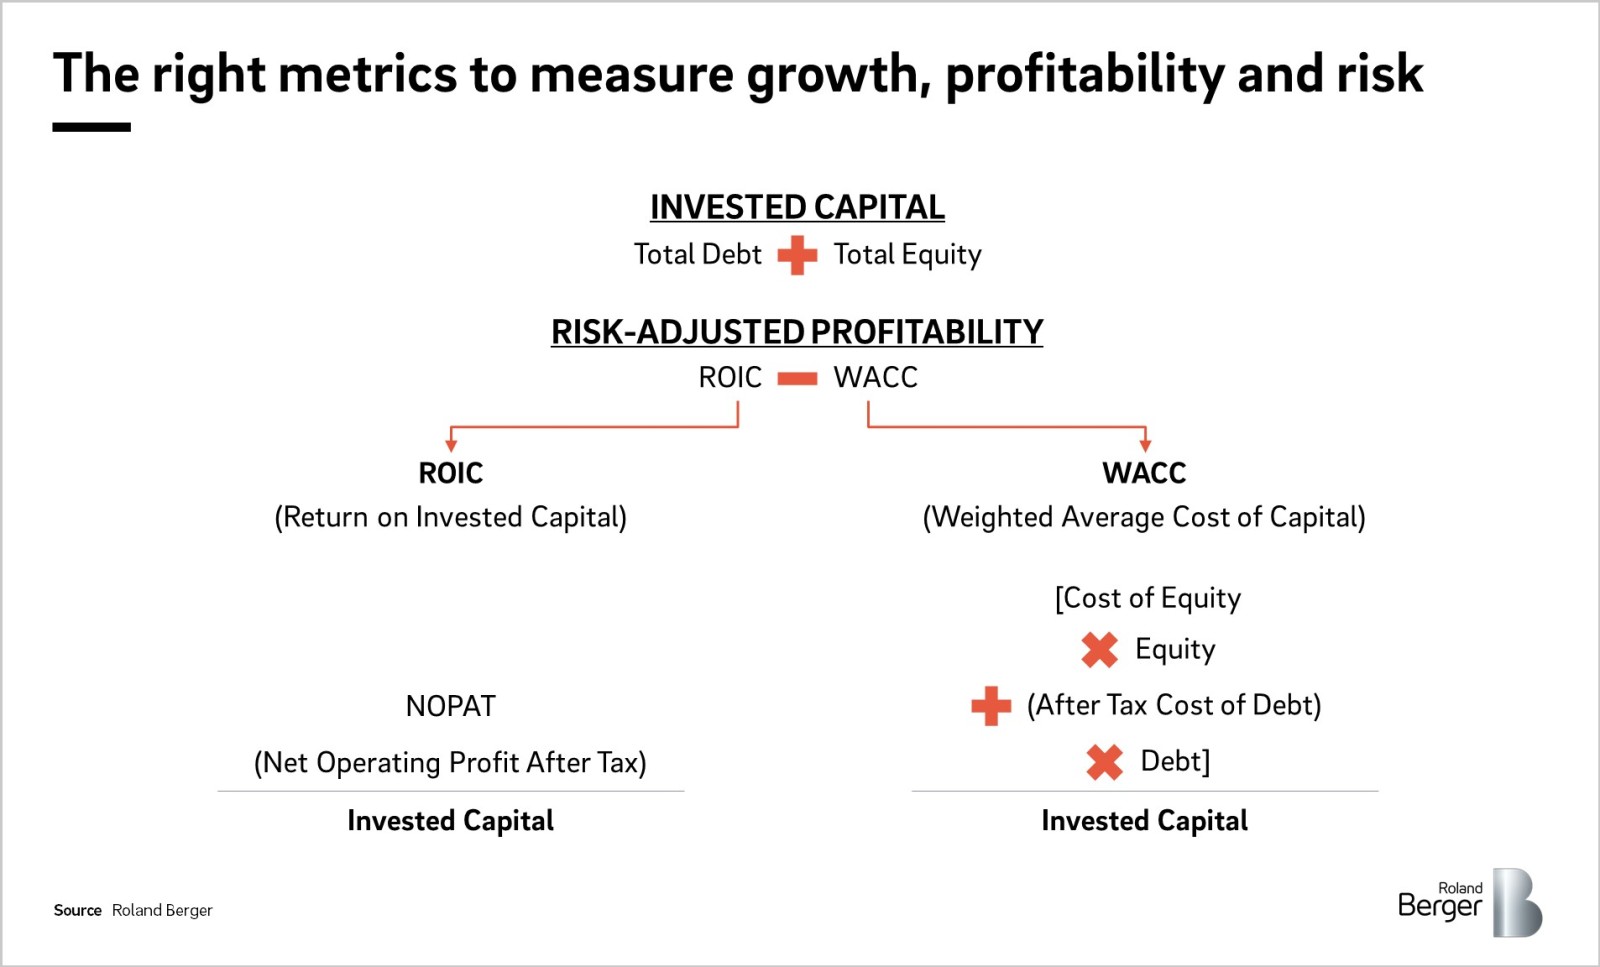
The Winners' metrics include:
- Growth in Invested Capital as a growth measure
- Return on Invested Capital (ROIC) after adjusting for risk (deducting the Weighted Average Cost of Capital (WACC)) as a profit measure
The Winners' analysis is described in more detail in Section 3. Within this document, we also assess conventional metrics such as revenue growth, EBIT, productivity ratios and risk and comment about total shareholder returns (TSR).
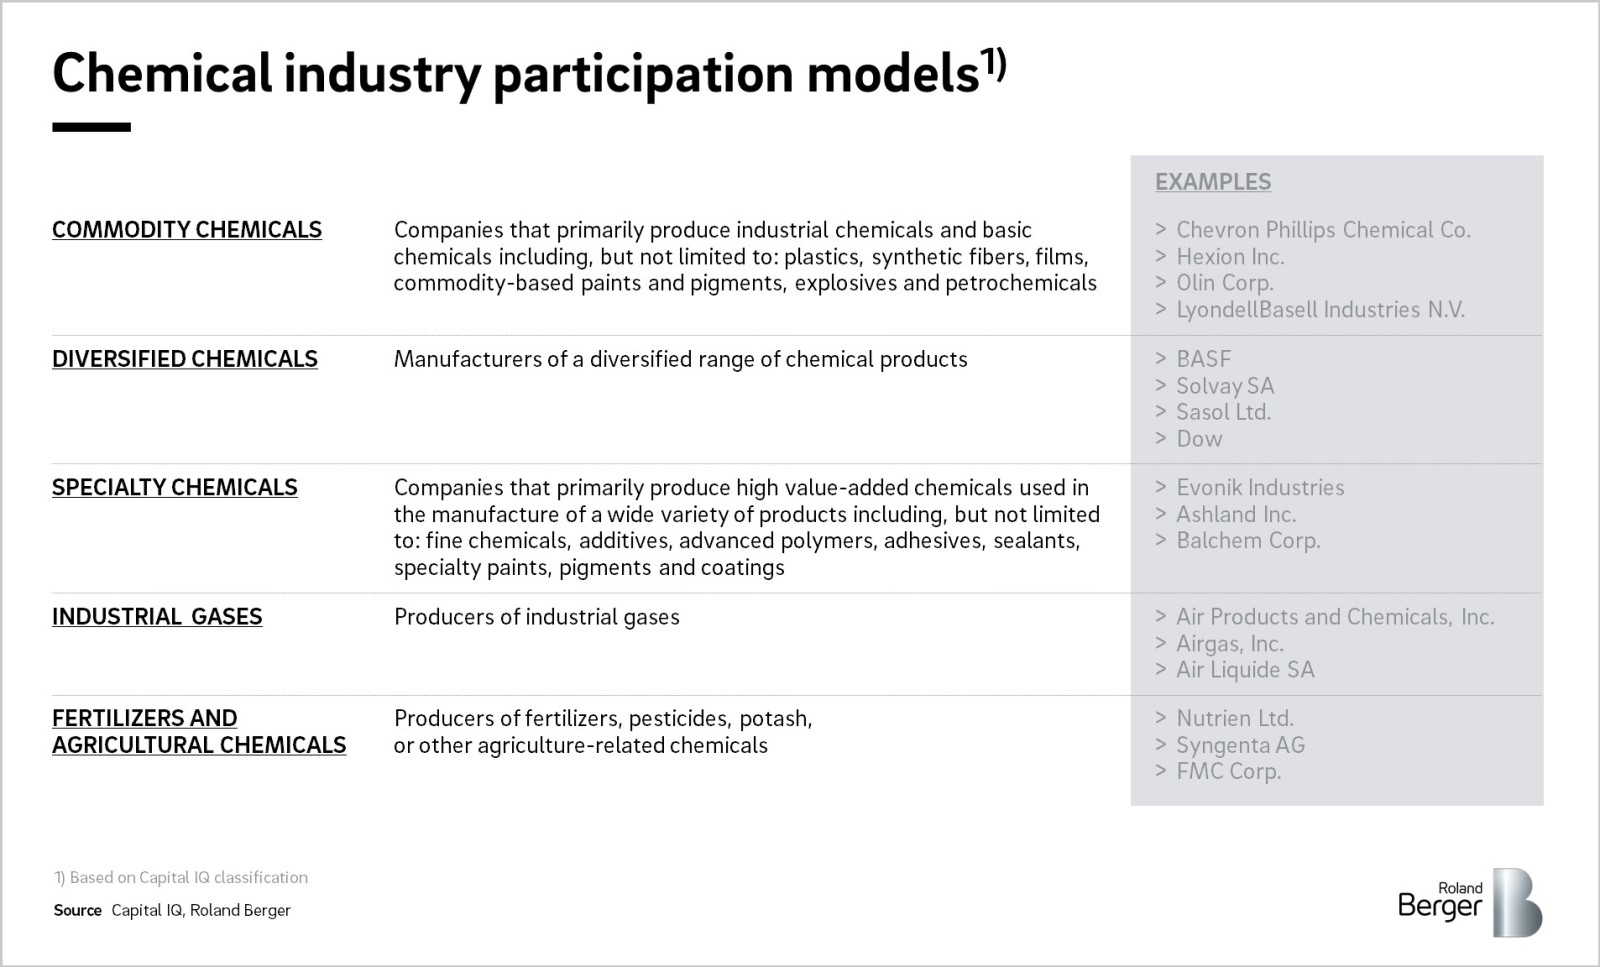
Section 1: Chemicals industry 2019 – a challenging year
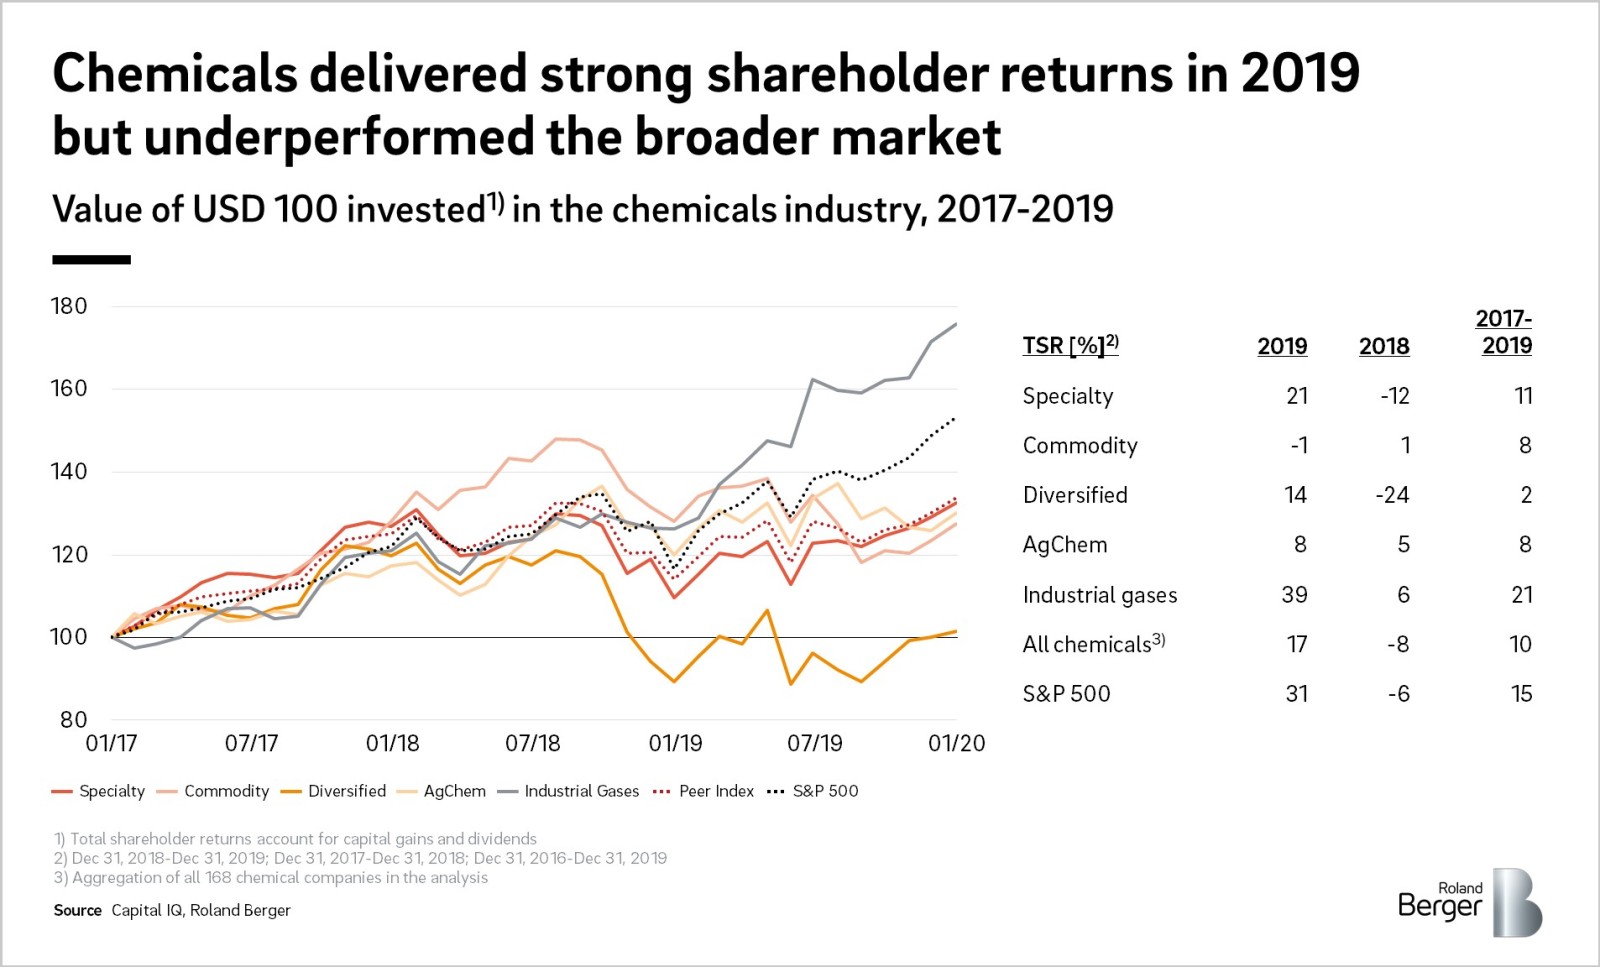
The Chemicals industry, with the notable exception of industrial gasses, significantly underperformed the S&P 500. While Total Shareholder Returns (TSR) for the industry exceeded 17%, which looks impressive, the TSR for the S&P 500 was 31%.
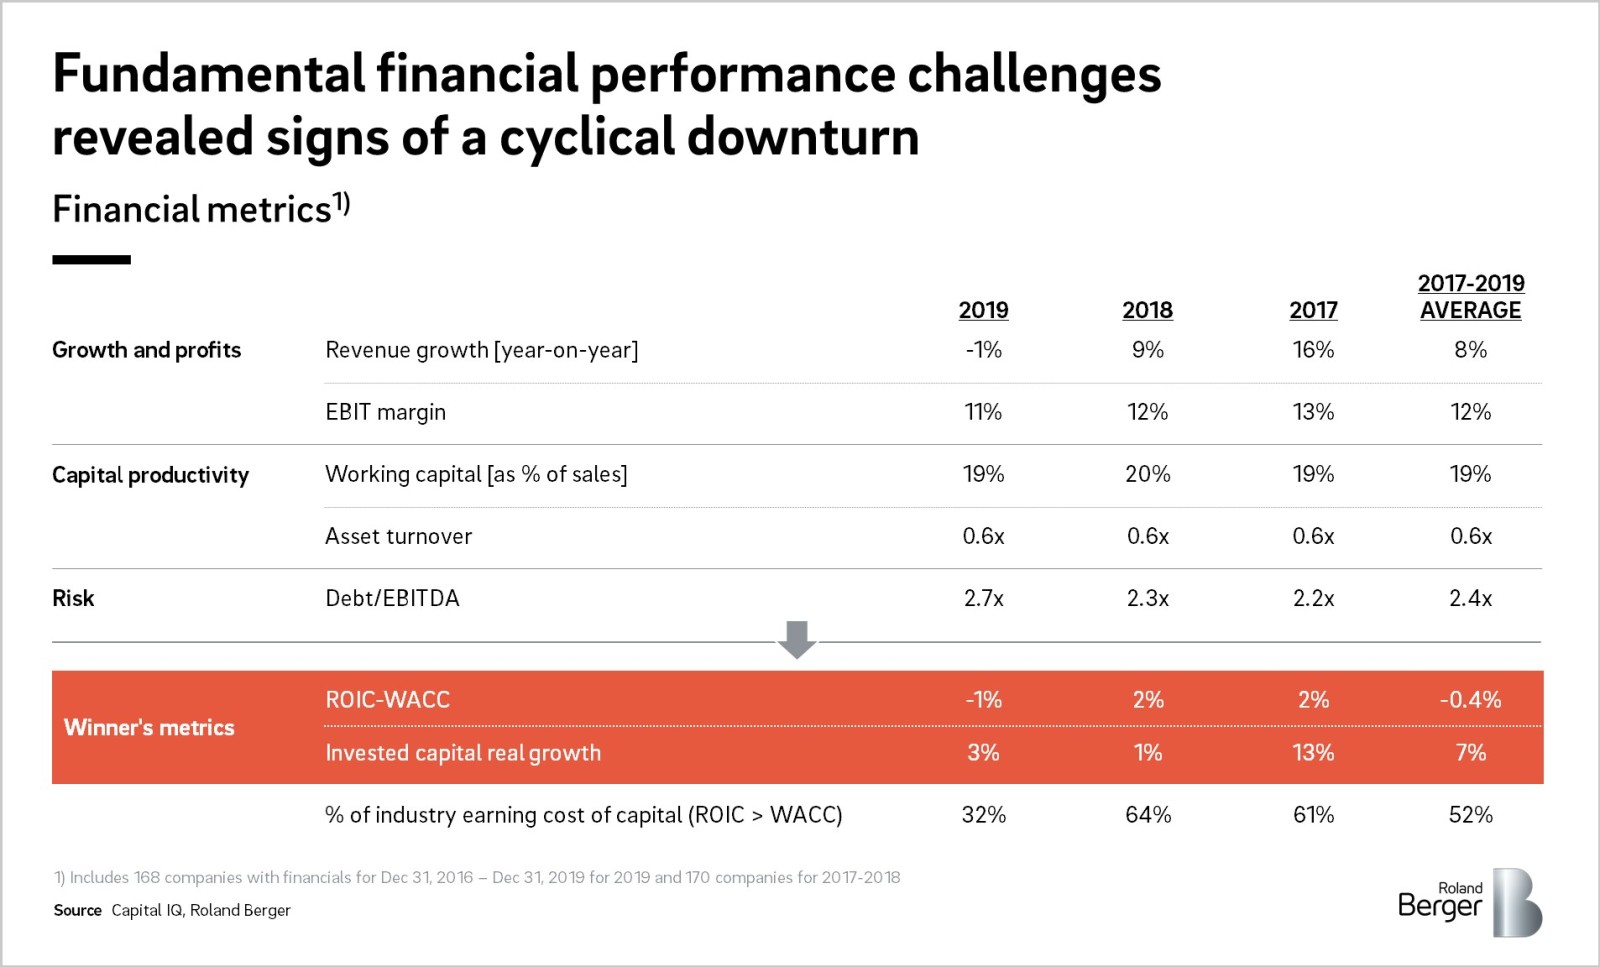
There was a fundamental decline in financial performance as the industry slowed down. On average, companies did not earn their cost of capital and did not grow, but increased balance sheet leverage significantly, by 17%, and increased share buybacks, all signs of a stagnant industry in a downcycle.
TSR – The Chemicals industry improved its returns but underperformed the S&P 500 index
The widening gap between the Chemicals industry and the S&P 500 can be attributed to a decline in industrial production in 2019, which was compounded by the continued uncertainty around the US-China trade war.
Looking at the performance of the different segments of the Chemicals industry only Industrial gasses outperformed the S&P 500, with a TSR of 39%. This can be explained by high consolidation of the industry (4 companies making up 70% of the Industrial gases segment) and productivity and synergy savings of 1.5-2% . By contrast Commodity chemical companies saw a TSR of -1%. This reflects the addition of significant new capacity which coincides with trade conflicts and slowing industrial production.
The Specialty chemical companies performed comparatively well with the market rewarding focused, pure-play companies. This is also reflected in recent M&A activity as companies shift to more focused portfolios.
GROWTH – Limited revenue growth in the industry amid manufacturing contraction
The combined revenue of the 168 companies in our analysis declined by 1% over 2018-2019, even after adjusting for the change in the oil price there was no growth.
Growth by chemical segment
- Specialty grew by 2.7%
- Commodity declined by 8.3%
- Diversified declined by 4.1%
- Agricultural Chemicals grew by 1.1%
- Industrial gases grew by 18.6% largely driven by M&A in the sector (Linde acquisition of Praxair)
The declines were due to industrial production slowing down. The increasing uncertainty is also seen in the lower level of capital investment which grew at 3%, significantly lower than 2017. The small increase in invested capital was driven by increased debt to fund transactions such as share buybacks.
2019 was not a year of significant M&A activity in the Chemicals industry as the number of announced deals in North America and Europe remained below historical levels and the average size of deals decreased by 35% relative to 2018. Among the M&A activities that occurred in 2019, there was a continued shift towards an increasingly focused portfolio from a diversified portfolio – as we have published in our previous Winners study, " Focus on Profits. "
MARGINS – Weakening demand and supply build-up squeezed profits
The Chemicals industry's EBIT margin decreased by 1% in 2019, due to weaker demand and oversupply in certain petrochemicals.
Margin by segment:
- Specialty shrank by 1 percentage point to 12%
- Commodity declined by 4 percentage points to 9%
- Diversified declined by 4 percentage points to 8%
- Agricultural Chemicals' margin remained flat at 12%
- Industrial gases' margin remained flat at 15%
The profit squeeze was driven by weaker demand in key end-markets, such as automotive which experienced a 6% decline in production in the first half of 2019 .
On the supply side there was significant global overcapacity of ethylene. During 2017-2019, 9 new ethylene crackers started in North America to take advantage of shale gas which led to an oversupply and a 20% decline in average cash earnings. This trend will continue, with 7 additional projects announced.
RISK-ADJUSTED RETURNS – Profitability suffered with only 32% of companies earned above cost of capital
The Chemicals industry had a negative risk-adjusted profitability (ROIC minus WACC) of -1% in 2019 and only 32% of the industry earned above cost of capital in 2019 - down from 64% in 2018.
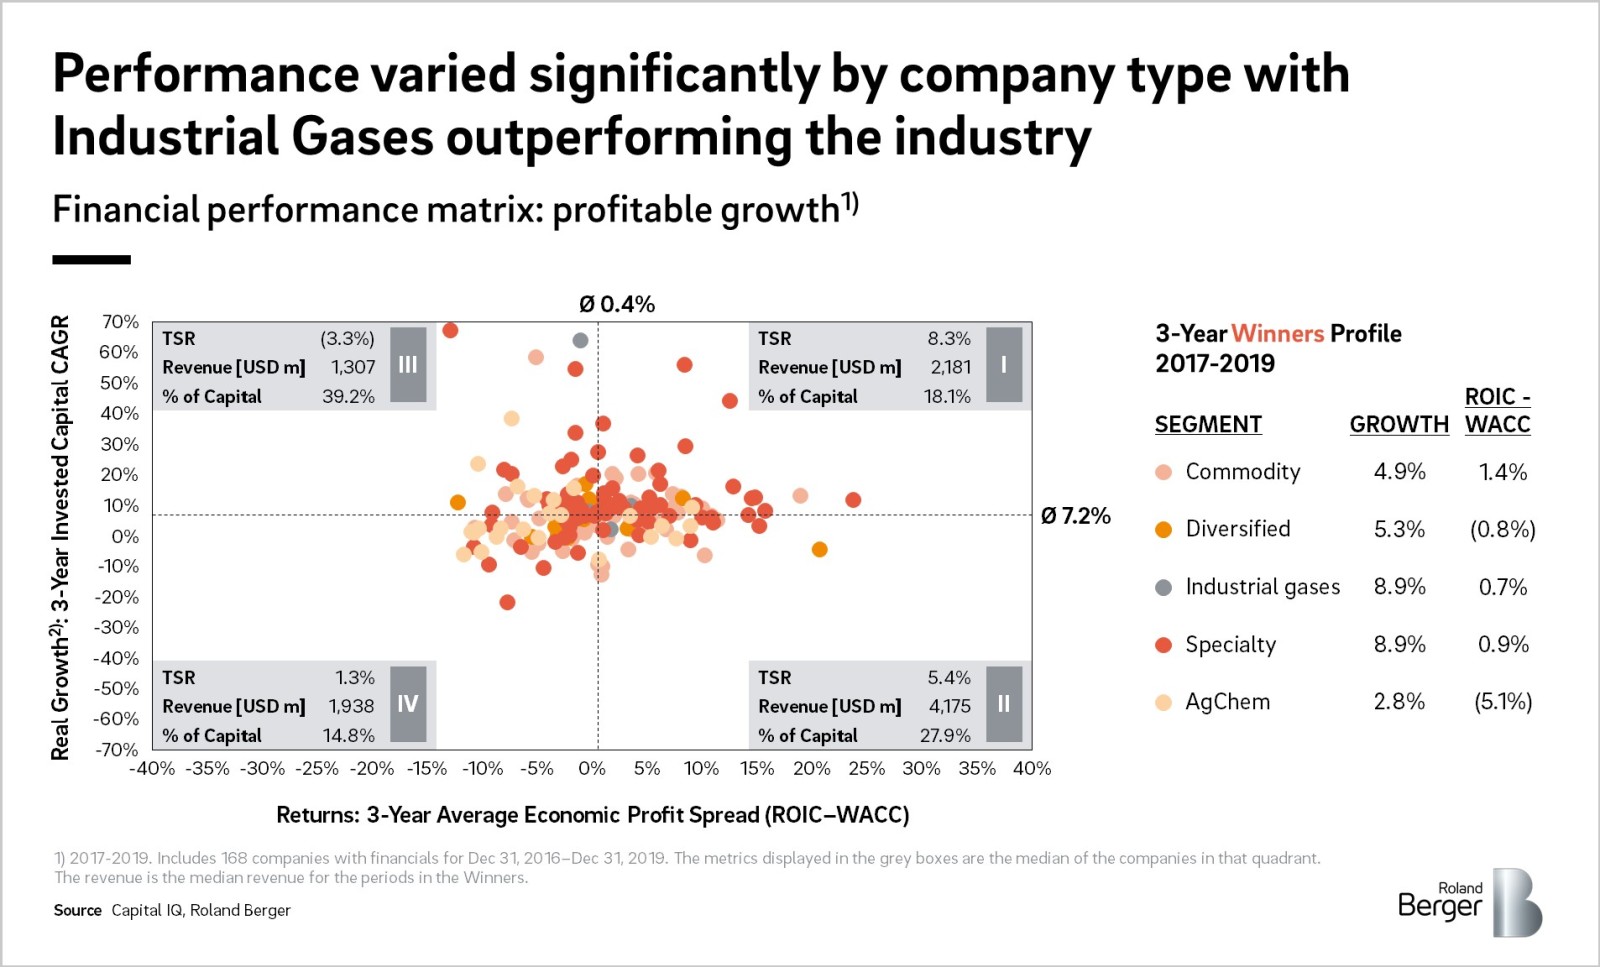
Risk-adjusted returns per segment over 2018-2019
- Specialty Chemicals shrank to -0.1% from 0.5%
- Commodity Chemicals shrank to -0.9% from 2.3%
- Diversified Chemicals shrank to -2.8% from -1.1%
- Agricultural Chemicals increased to -3.9% from -4.7%
- Industrial Gases shrank to 0.6% from 0.9%
Poor return performance was driven by the contraction in EBIT discussed above – the cost of capital mostly declined in 2019 due to lower interest rates.
The poor performance of Agricultural Chemicals is directly attributable to the US China trade wars and its direct impact on soy and other agricultural commodities.
DEBT – Debt increased to fund share buyback; long term investments deferred
The Chemicals industry increased its debt by 6% over 2018-2019, driving up Debt/EBITDA ratio to 2.7x from 2.3x as the industry took advantage of the low interest rate. This increase in debt was largely used to fund share buybacks, which increased by 50% over 2018 levels.
Chemicals M&A activity was significantly lower than 2018, and the average value of transactions declined by 35%. A much larger portion of M&A was driven by private equity with strategic players more internally focused (7% of acquisition volume was driven by buyout funds vs. about 5% in 2018).
Section 2: Trouble ahead
The ongoing COVID-19 pandemic has taken a toll on key end markets of the Chemicals industry. For example, the oil & gas industry is expected to see a demand decline of 30% in Q2 2020 while the automotive industry is estimated to experience a 15%-40% drop in US sales in 2020 according to our report "COVID-19 impact and priorities for automotive companies". With the Chemicals industry already highly leveraged relative to its historical levels, the current market situation poses a significant financial risk.
_large_image.jpg)
Our analysis evaluated the financial risk of 168 companies in the Chemicals industry along two dimensions: leverage and potential revenue impact from exposure to end markets significantly impacted by COVID-19. Our estimates indicate that 28% of the industry's invested capital is a high risk due to a combination of high balance sheet leverage and high exposure to COVID-19. The market has clearly recognized this risk, as illustrated by poor TSR performance and high yield on outstanding debt of high-risk companies.
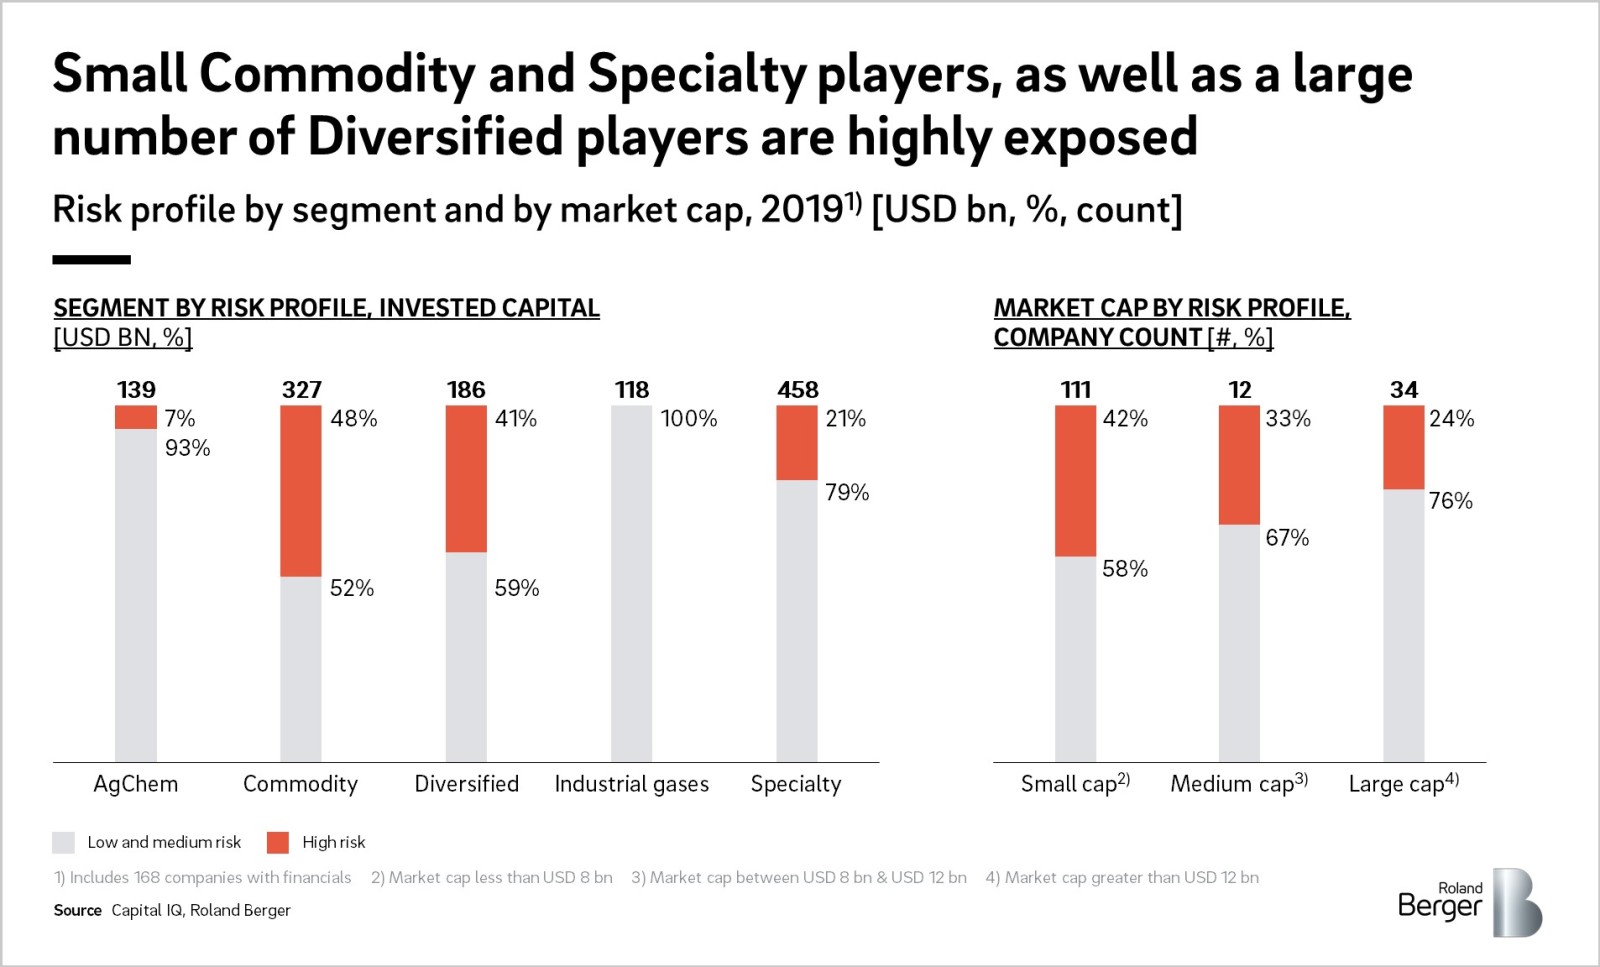
There are clear patterns to the companies in the different vulnerability zones we have identified. A significant portion of the high-risk constituents are focused players of smaller size, either Commodity or Specialty – the average invested capital for the high-vulnerability zone was USD 5.4 bn while average invested capital for low risk was USD 9.1 bn. 76% of high risk companies had invested capital less than the industry average of USD 7.3 bn.
Many of these smaller companies have more focused portfolios and therefore a more concentrated exposure to end markets impacted by COVID-19. The majority of midcap Diversified chemicals companies are also in the high-vulnerability zone. Their broader portfolios tend to mirror the economy giving them significant exposure to automotive and construction. We estimate that 80% of Diversified have a medium to high revenue impact from the crisis. Furthermore, most of the Diversified players entered 2020 with high leverage ratios, often the result of recent acquisitions.
Low- and medium-vulnerability companies are either expected to be more resilient to the COVID-19 impact, based on exposure to resilient end markets like Agriculture or Healthcare, or are larger companies that have the benefits of scale, geographic and portfolio breadth, and stronger balance sheets.
If the COVID-19 induced crisis persists and the recovery is slow and extended over time, these risks will likely turn into significant financial challenges for these companies, potentially resulting in significant structural changes in the Chemicals industry.
This means action now is required. Companies in the high-risk zone need to pursue comprehensive performance improvement programs to drive cash flow, clean up their balance sheets, and reassure the market. Generating cash is paramount and should be easier in a contraction: companies unable to do so will raise serious red flags for investors. Diversified players have an advantage over smaller players: the ability to sell non-core portfolio businesses. While the timing and valuations may be unattractive, it may provide an opportunity to raise cash in a difficult credit market environment.
On the other end of the spectrum larger companies that are expected to fare better during the crisis. They may see this as a good opportunity to fill white spaces in their portfolios at attractive valuations. Based on the lessons from 2008-2009, caution is required as deals in uncertain times create challenges. "Friendly" deals will require convincing potential sellers to divest the desired assets and explaining high valuation multiples and acquisition premia to investors. Hostile takeovers may add to significant existing turmoil inside the target's organization, impacting their commercial position and performance.
Appendix: Roland Berger Winners' metrics
When developing their expectations of financial performance of a company, investors, both implicitly or explicitly, are analyzing its profitability and growth potential, and adjusting these metrics for risk. Typically, investors will develop a financial forecast to build a free cash flow model. Revenue growth will be used as the growth metric, EBIT margin percentage as the profitability metric, and the cost of capital representing the risk adjustment. We believe the best metric to analyze growth is the real growth in the invested capital of a company, which represents the capital on a company’s books which finances its assets. It is a better metric to measure growth compared to revenues, which is more commonly used. Revenue trends can be misleading due to price volatility, driven by raw material fluctuations or supply and demand dynamics. Invested capital growth measures the growth in assets and represents additional investment into the enterprise and is not as affected by raw material price changes. We believe the best metric to measure risk-adjusted profitability takes the difference between the return on invested capital (ROIC) and the weighted average cost of capital (WACC).
It is better than EBIT margin because it is a normalized metric, which measures not only profitability, but the amount of capital required to generate the profitability. EBIT margins provide no perspective on the capital intensity of a company and therefore may be misleading when comparing companies with different business models.