Oilfield Services Winners 2019
By Gareth Hayes and Robert Henske
Saved by capital market buoyancy in 2019, broken by Covid-19 in 2020?
2019 was another very challenging year for the battered Oilfield Equipment and Services (OFES) industry, extending the "Lost Decade" described in our 2019 newsletter. All financial metrics declined, from revenue growth to EBIT margins, while leverage ratios increased. Only 2% of companies earned their cost of capital, down from 16% a year earlier.

Total shareholder returns looked positive but were driven by general growth in financial markets. The OFES industry under performed in the S&P 500 but still experienced growth in value.
Key takeaways on 2019 performance:
- The OFES industry rebounded in shareholder returns but still underperformed the S&P 500 in 2019, 17% TSR vs. 31% for S&P 500
- Revenues increased by 3% but growth slowed by 5% compared to 2018
- Only 2% of the industry earned their cost of capital, down from 16% in 2018
- Leverage remained high as Debt/EBITDA ratio increased from 4.4x to 4.6x, due to Focused and Category Leader companies securing financing to keep afloat
- Limited improvement in operations as working capital decreased by 1% compared to 2018, but asset turnover and Return over Invested Capital remained level
Going forward, the collapse in oil prices associated with the COVID-19 crisis may be a breaking point for an industry that has until recently been kept on life support with generous help from capital markets. With over half of the industry as highly vulnerable financially in the current environment, significant industry restructuring is likely to happen: bankruptcies (liquidations, not the Chapter 11 version) and consolidation of distressed players. The magnitude of the change will depend on the recovery of oil demand and oil prices. Protracted recession scenarios greatly increase the chance of permanent oil demand destruction which could drive the need to rationalize the OFES industry.
Key takeaways on financial risk analysis:
- 55% of the industry's invested capital is at high financial risk, with Focused and Regional Diversified players being the most exposed
- Larger companies who offer multiple services across multiple major oil & gas basins appear to be more resilient
- COVID-19 is likely to bring bring about structural change through the forms of bankruptcy and M&A, leading to higher industry concentrationThe Winners' analysis lets companies understand their performance relative to the industry.
The Winners' metrics are described in more detail in Section 3. Our Roland Berger Oilfield Services team would welcome the opportunity to offer perspectives on company-specific performance and give you our external view on the strategic challenges facing the industry.
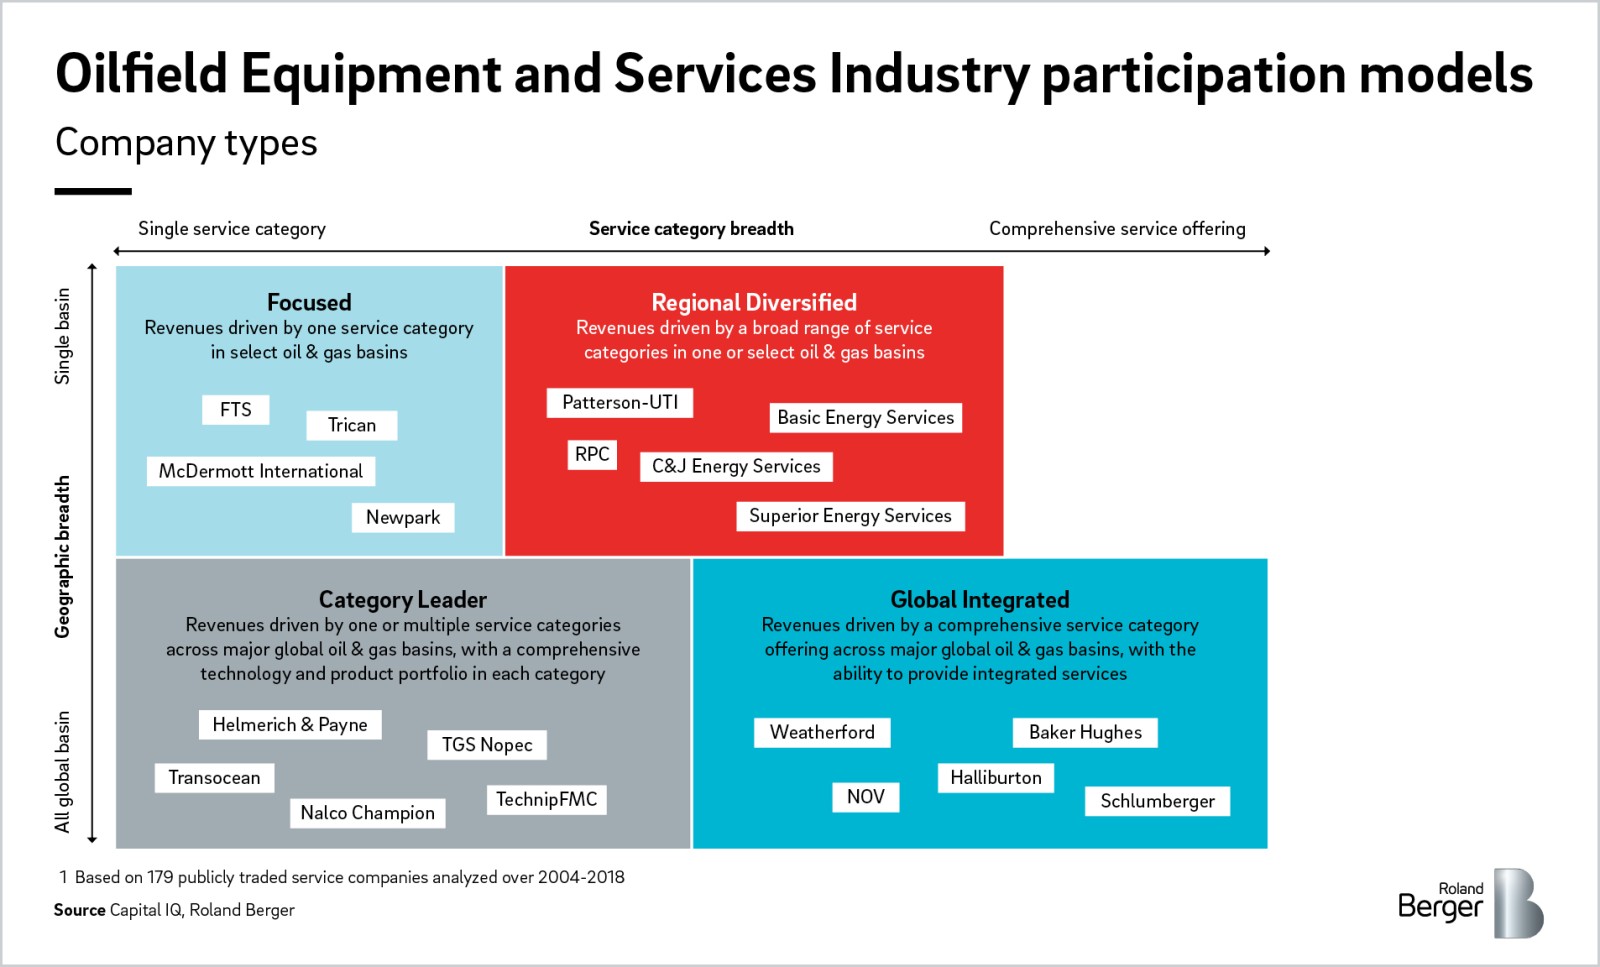
An overview of Roland Berger's Winners' documents
As an analytical underpinning to our strategy and operations support to the OFES industry, we regularly monitor the financial performance of nearly 160 OFES companies headquartered in the US or in Europe. This document provides an inside look of the performance of the industry using both Winners' metrics and conventional financial metrics and highlights trends that these numbers unveil.
The Winners metrics include:
- Growth in Invested Capital as a growth measure
- Return on Invested Capital (ROIC) after adjusting for risk (deducting the Weighted Average Cost of Capital (WACC)) as a profit measure
The Winners' is described in more detail in Section 3. Within this document, we also assess conventional metrics such as revenue growth, EBIT, productivity ratios and risk and comment about total shareholder returns (TSR).
Another challenging year…
In 2019, the OFES industry recovered much of its stock market losses of 2018, delivering Total Shareholder Returns (TSR) of 17% based on the average of 157 companies in our analysis [Exhibit 1]. The industry benefitted from a generally favorable investment environment as its financial performance was impacted by lower oil prices and a reduced rig count globally and in the US. The set of 157 companies in our analysis showed no growth in invested capital as it declined by 2% in 2019. On average, the set's risk-adjusted profitability [Return on Invested Capital (ROIC) – Weighted Average Cost of Capital (WACC)] was -14% and only 2% of companies earned their cost of capital – further dropping from last year's already low 16% and far below the industry's cycle average over 2008-2014 when 30% of the industry earned their cost of capital. Despite this challenging performance, the industry exceeded low investor expectations and was able to deliver returns but inherently continued to rely on financial markets to stay afloat.
TSR
Significant improvement in TSR but mostly recovery from the late 2018 dip
The OFES industry significantly improved its TSR performance in 2019 after seeing a sharp drop in 2018. The peer index consisting of 157 companies showed a return of 17% in 2019 compared to -26% in 2018, with the Regional Diversified players even outperforming the S&P 500 in 2019 after significantly underperforming in 2018 [Exhibit 1]. However, this was mostly a recovery from the declines in late 2018 when WTI crude oil prices fell from USD 76/bbl in early October to USD 44/bbl in late December. 2019 finished strong with a more positive sentiment around oil price (USD 60/bbl in Dec. 2019)[1] and a strong stock market which masked the challenges of the industry in 2019.
[1] EIA
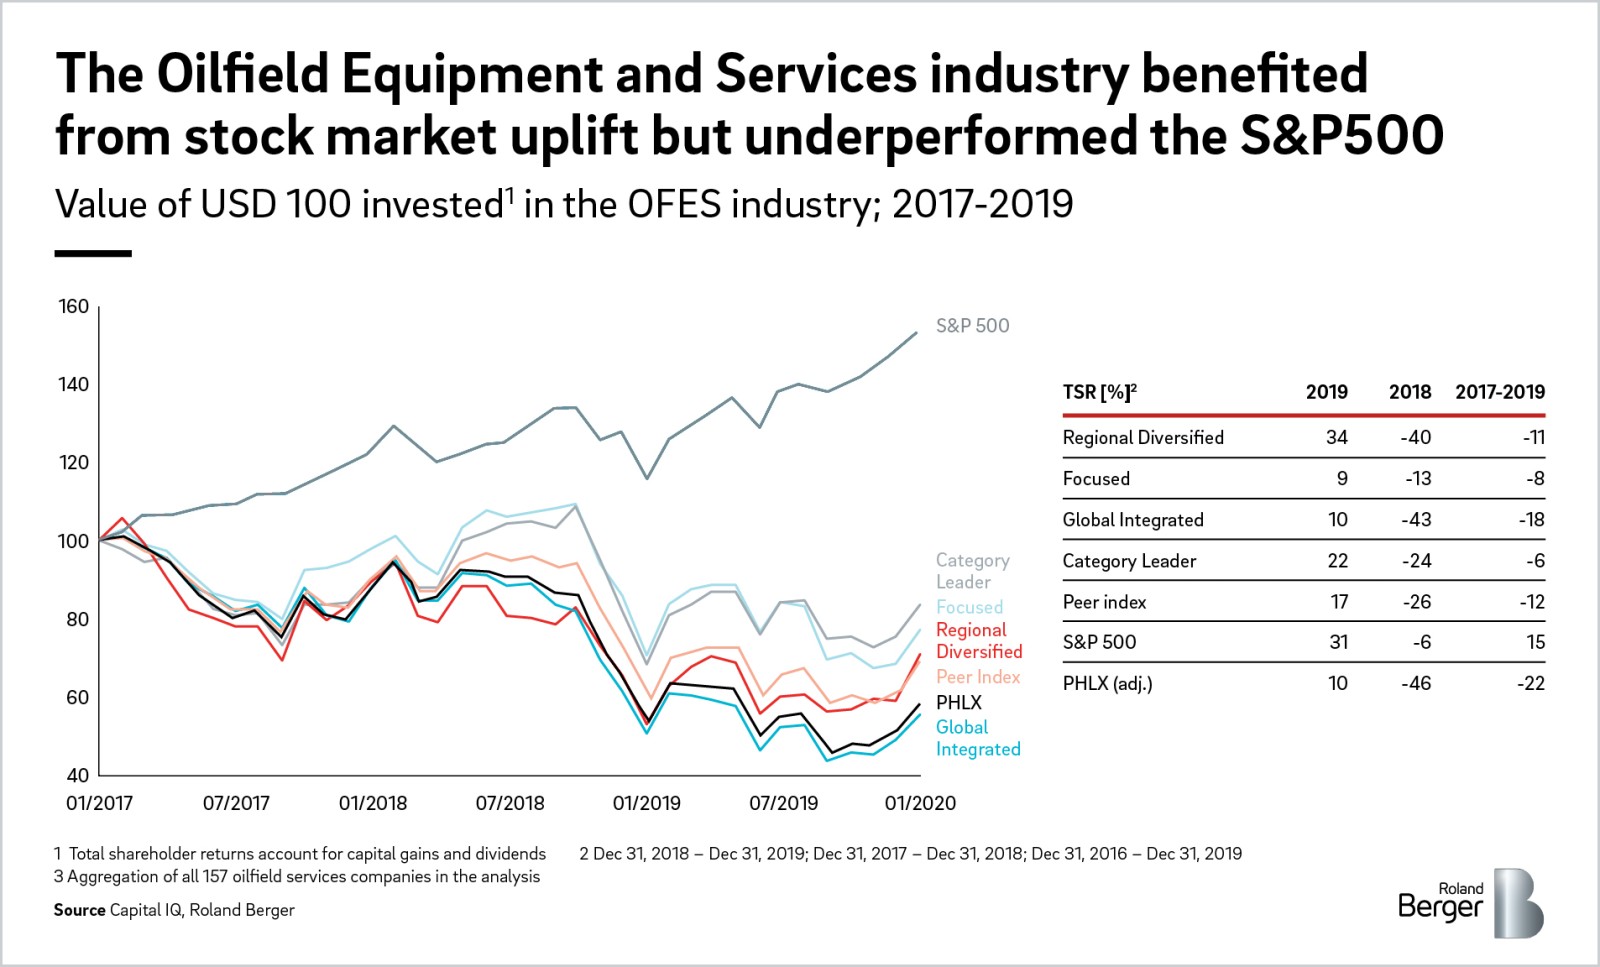
Yet, OFES severely underperformed the S&P 500 over 2017–2019, with the peer index showing a return of -12% compared to 15% of the S&P 500. There were also increased discrepancies among segments in 2019 as Global Integrated players continued to suffer while Category Leader players were able to recover much more quickly [Exhibit 1].
Growth
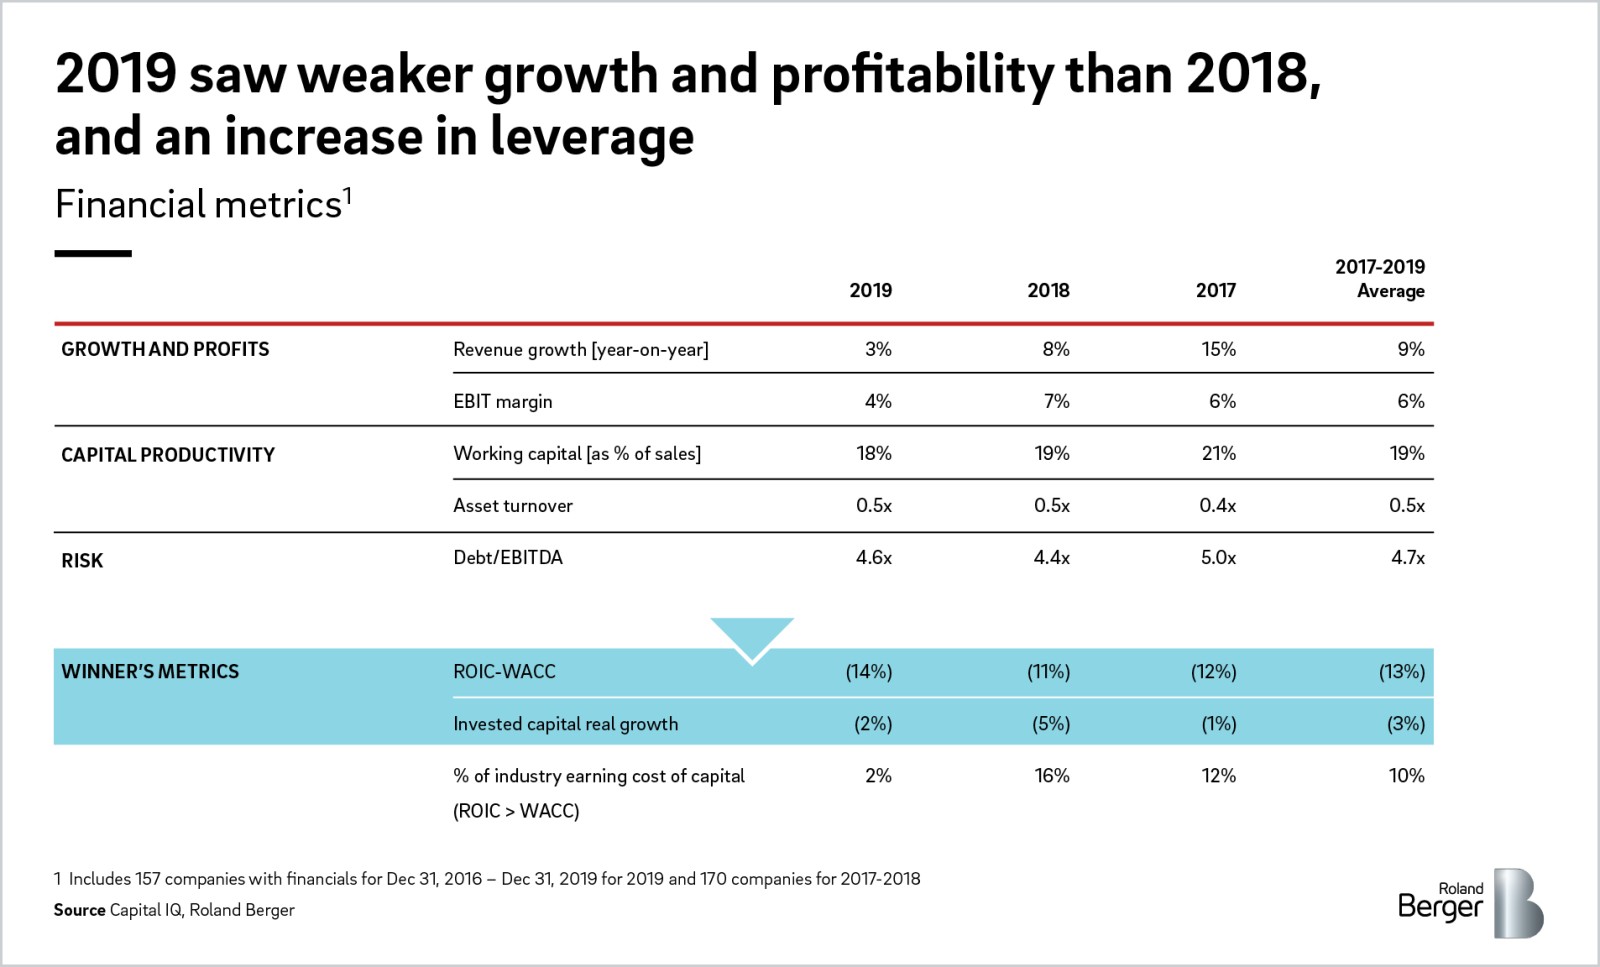
Deceleration of growth
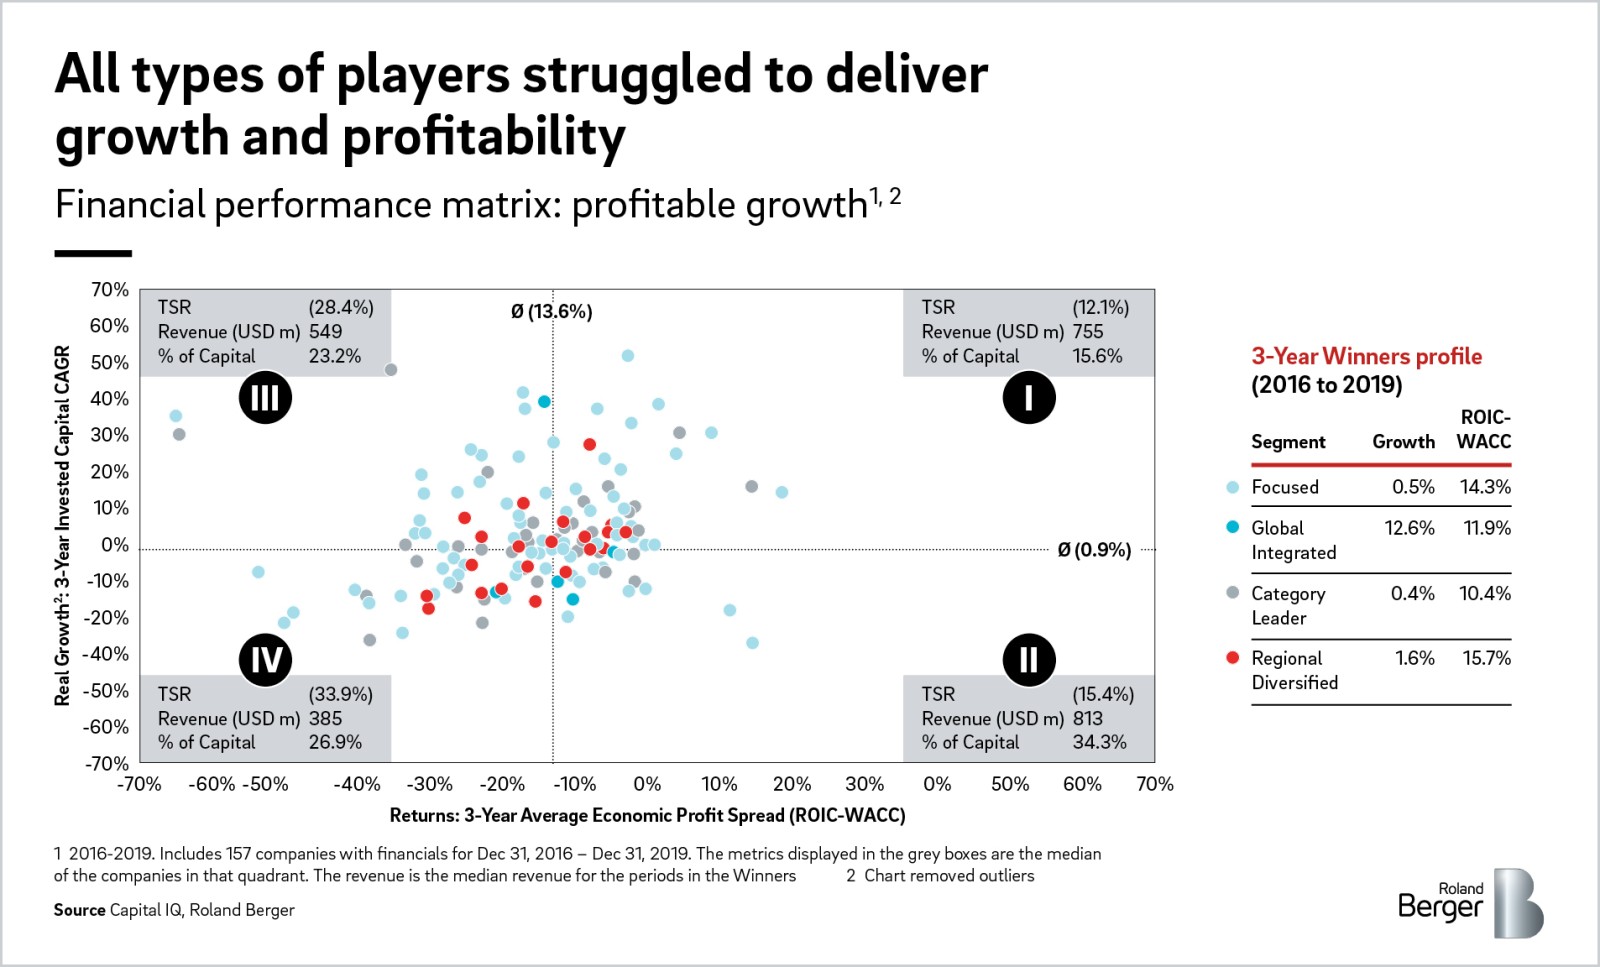
In 2019, combined revenue increased by 3% but growth decelerated by 5 percentage points when compared to 2018 [Exhibit 2]. This can be attributed to lower oil price and reduced rig count in 2019 – WTI crude oil prices averaged $57/bbl in 2019 vs. $64/bbl in 2018 and global rig count decreased by 5% in 2019[1]. Capital expenditures were also 9% lower in Q3 of 2019 when compared to Q3 of 20181. Over 2018-2019, Europe fared better than North America with a revenue growth of 3.9% vs. -1.0% as the U.S. saw a more notable decline in rig count. Over the same time period, Focused players and Category Leaders outperformed the industry with 5% revenue growth, while Global Integrated and Regional Diversified had revenue declines of 1% and 2% respectively. This is also reflected in the 3-year TSR performance, in which Focused players and Category Leaders outperformed the other two segments. On the other hand, invested capital declined by 2% as the industry saw a decline in net income and total equity.
[1] S&P
MARGINS
Margin squeeze due to lower oil price and CapEx cuts
With lower Exploration & Production (E&P) capital expenditure and lower oil prices, the OFES industry's EBIT margin decreased by 3% in 2019 [Exhibit 2]. In addition, increased productivity has reduced demand for oilfield equipment and services, putting additional downward pressure on product prices. In 2019, all segments except for Regional Diversified reported EBIT margins that were in line with the industry – Regional Diversified suffered the most on profitability with an EBIT margin of just 1%.
RISK-ADJUSTED RETURNS
Only 4% of the industry earned cost of capital
The industry continued to destroy value, by earning a catastrophic 14% less than its cost of capital - a drop of 3% year on year [Exhibit 2]. In addition, only 2% of the industry earned their cost of capital in 2019 - down from 16% in 2018. This was far below the cycle average over 2008-2014 when 30% of the industry earned their cost of capital. In 2019, all segments had returns below cost of capital, but Regional Diversified had the worst performance at -17% below cost of capital. Over 2017-2019, the Category Leader segment was the best performer, despite not earning its cost of capital with average risk-adjusted returns of -10% [Exhibit 3], reflecting the dramatic performance challenges of the industry.
DEBT
Increasing debt and solvency risk
Amid lower oil prices and shrinking margins, the OFES industry was able to secure additional financing to keep afloat. The set of 157 companies in our analysis increased debt levels by 3% over 2018-2019 despite margin compression, driving up already high leverage ratios (Debt/EBITDA) to 4.6x from 4.4x the year before, significantly increasing default risk [Exhibit 2]. Much of the increase in debt in 2019 could be attributed to Focused players and Category Leaders, some of which secured rescue financing. In spite of efforts to avoid solvency, a total of 21 oilfield services companies filed for bankruptcy in 2019 – 75% higher than the previous year[1]. It is interesting to note that TSR performance benefitted from the general stock market uplift despite a clear increase in balance sheet risk.
CAPITAL PRODUCTIVITY
Slight improvement despite higher focus on capital discipline
With increased pressure from investors for tight capital discipline, the OFES industry reduced its working capital in 2019. Working capital as % of sales decreased by 1 percentage point relative to 2018 – below the cycle average of 22% over 2008 – 2015 [Exhibit 2]. Yet, its asset turnover ratio and return over invested capital remained at 2018 levels, showing limited improvement in operations.
Several years of financial and stock market underperformance have left the OFES industry in dire shape. Just as the situation seemed to be improving in 2020, the OFES industry was hit with another unprecedented challenge with COVID-19 causing a 35% drop in oil demand and a collapse in oil prices (with 20-year low monthly averages and an unprecedented foray into negative territory). Further, there is significant risk of lasting supply-demand imbalance given in the likely slow economic recovery and the potential for permanent oil demand destruction given post-COVID- behavioral changes in trade and transportation. This is going to create significant pressure on oilfield stocks.
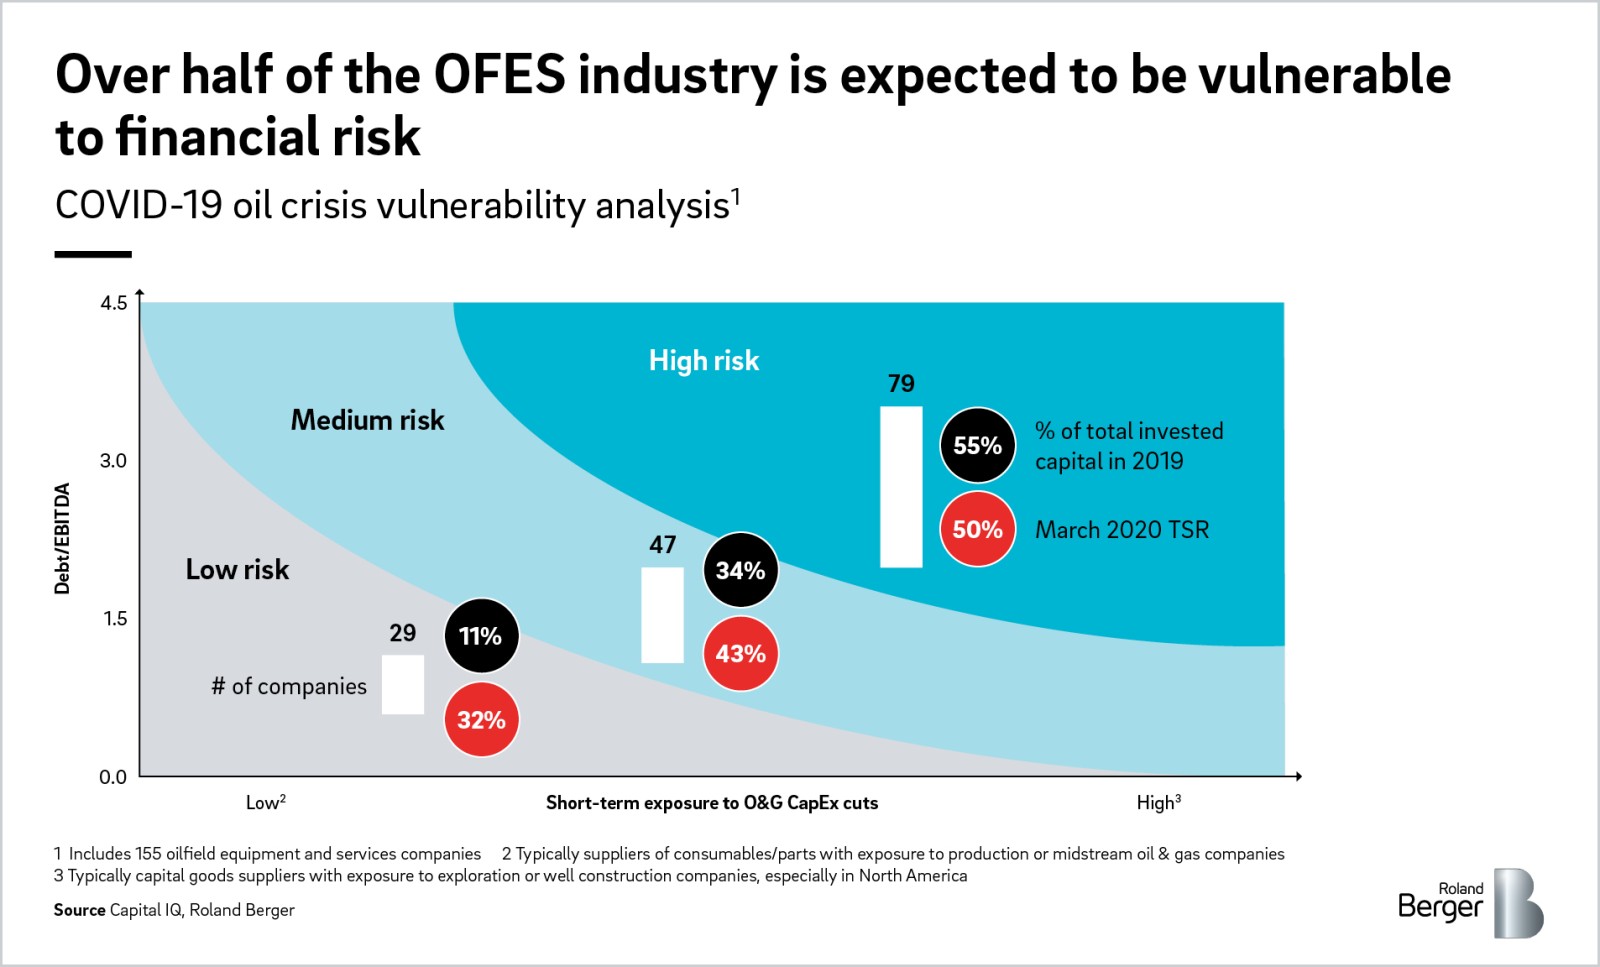
Our analysis evaluated the financial risk of 155 companies in the OFES industry along two dimensions: leverage and short-term exposure to oil & gas capital expenditure cuts. It indicates that 55% of the industry's invested capital is at high risk due to a combination of high balance sheet leverage and high exposure to oil & gas capex in the short-term [Exhibit 4]. Investors have built the risk into its valuations, driving catastrophic year-to-date performance for the oilfield sector, with a 45% decline through end of May relative to a 5% decline for the S&P500 index. This is going to create significant pressure on oilfield stocks.
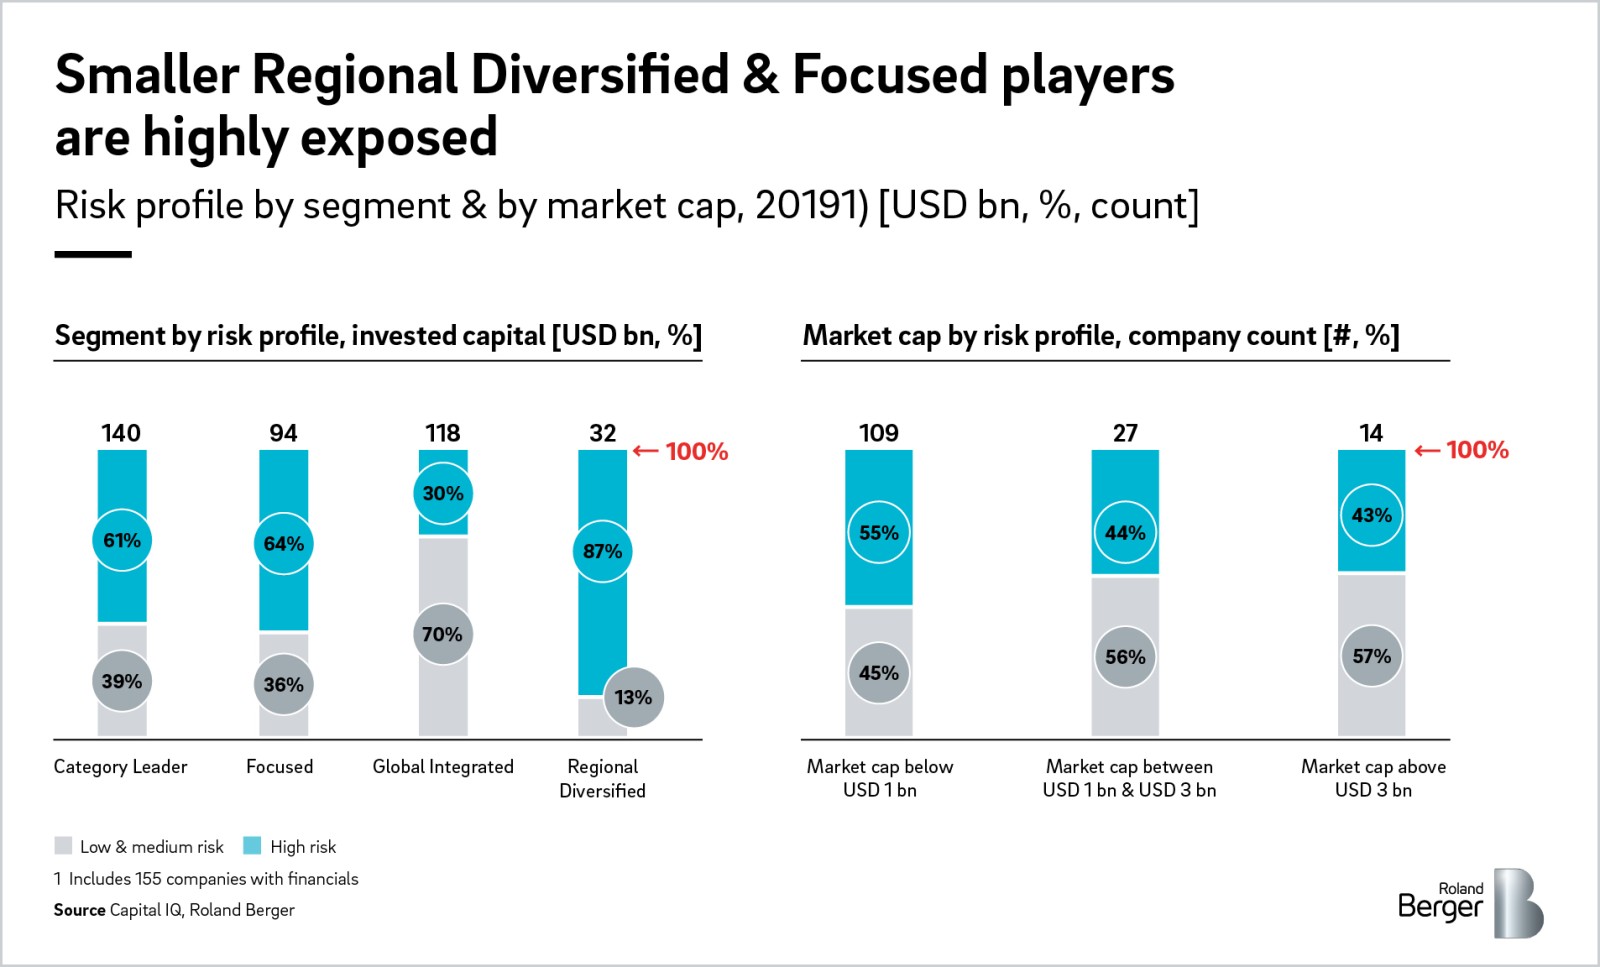
There are clear patterns to the companies in the different vulnerability zones we have identified. Global Integrated players have fared much better, thanks to their larger size and their portfolio diversification along both geographic basins and the well lifecycle. Indeed, their exposure to international plays – more resilient in the short-term to oil downturns - typically balances their exposure to North American shale – very reactive to oil price changes. From a well lifecycle standpoint, their exposure to the more stable production and midstream sectors balances out their participation in exploration, drilling, or completions.
In contrast, a significant portion of the high-risk companies are Focused and Regional Diversified players of smaller size – the average invested capital for high risk companies was USD 2.7 bn while the average invested capital for low risk companies was USD 1.3 bn [Exhibit 5]. These players are typically shale focused, and much more likely to have built businesses around the previously booming set of well construction services such as drilling, cementing, hydraulic fracturing, and supporting equipment and services. Many Focused and Regional Diversified players already went bankrupt during the 2014-2017 oil downturn, only to resurface a few months later after their debt was restructured. Capital markets and potential suitors may not be as generous this time – with the potential for significant permanent oil demand destruction, bankruptcies may take the form of Chapter 7 liquidations instead of Chapter 11 restructuring. For these players, ambitious performance improvement plans need to be established and executed immediately to increase chances of survival.
Appendix: Roland Berger Winners' metrics
When developing their expectations of financial performance of a company, investors, both implicitly or explicitly, are analyzing its profitability and growth potential, and adjusting these metrics for risk. Typically, investors will develop a financial forecast to build a free cash flow model. Revenue growth will be used as the growth metric, EBIT margin percentage as the profitability metric, and the cost of capital representing the risk adjustment. We believe the best metric to analyze growth is the real growth in the invested capital of a company, which represents the capital on a company’s books which finances its assets. It is a better metric to measure growth compared to revenues, which is more commonly used. Revenue trends can be misleading due to price volatility, driven by raw material fluctuations or supply and demand dynamics. Invested capital growth measures the growth in assets and represents additional investment into the enterprise and is not as affected by raw material price changes. We believe the best metric to measure risk-adjusted profitability takes the difference between the return on invested capital (ROIC) and the weighted average cost of capital (WACC) [Exhibit 6].
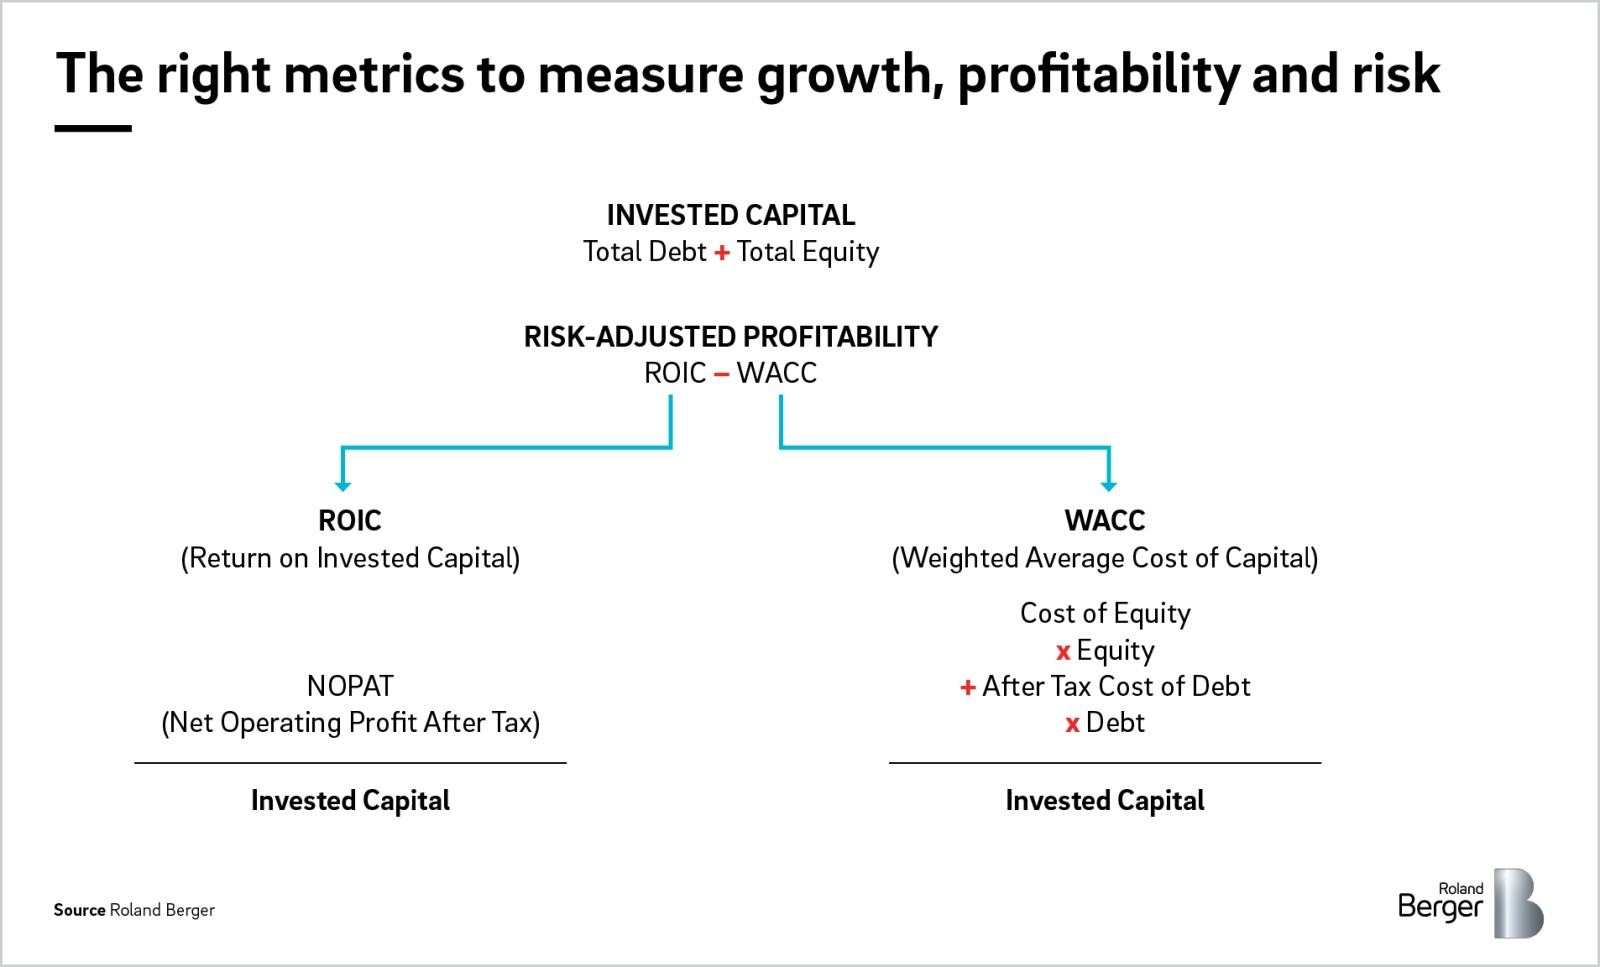
It is better than EBIT margin because it is a normalized metric, which measures not only profitability, but the amount of capital required to generate the profitability. EBIT margins provide no perspective on the capital intensity of a company and therefore may be misleading when comparing companies with different business models.